Introduction
How to get synthetics monitoring to work in new relic? In today’s digital world, ensuring the performance and availability of your applications and websites is crucial. Users expect seamless experiences, and any downtime or performance issues can lead to lost revenue, diminished customer satisfaction, and damage to your brand reputation. That’s where synthetics monitoring comes in.
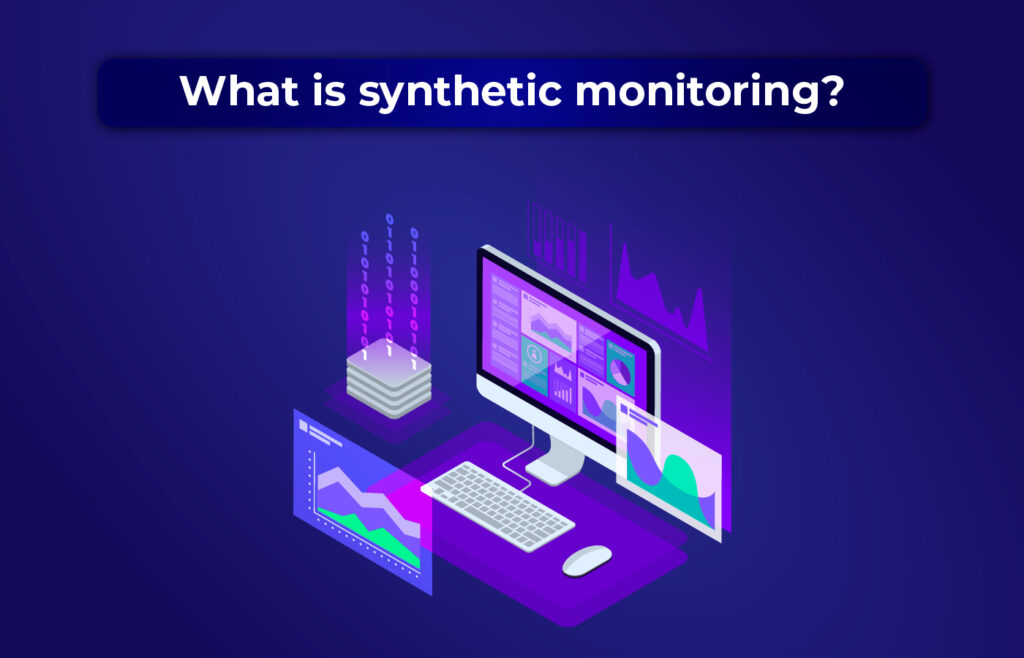
Synthetics monitoring is a proactive approach to monitoring applications and websites by simulating user interactions to detect issues before they impact real users. New Relic, a leading observability platform, offers a robust synthetics monitoring solution that allows you to monitor the availability, performance, and functionality of your applications and websites from various global locations. In this blog post, we will explore how to get synthetics monitoring to work in New Relic, and provide a step-by-step guide to help you set it up effectively.
Why Synthetics Monitoring?
Synthetics monitoring enables you to simulate user interactions with your applications and websites, helping you identify issues and troubleshoot them proactively. By monitoring the availability, performance, and functionality of your applications and websites from various global locations, you can gain insights into how your applications perform in different regions and under different network conditions. This can help you detect and fix issues related to latency, availability, and functionality, ensuring a smooth experience for your users across different geographies.
With synthetics monitoring, you can set up automated tests that mimic user interactions, such as clicking buttons, filling out forms, and navigating through different pages. These tests can be scheduled to run at regular intervals or on-demand, allowing you to continuously monitor the health of your applications and websites. When an issue is detected, you can receive real-time alerts, allowing you to take proactive actions to resolve the issue before it impacts your users.
Synthetics monitoring can also help you measure and track key performance metrics, such as response time, load time, and error rate, giving you insights into the performance of your applications and websites over time. This can help you identify trends, set performance benchmarks, and make data-driven decisions to optimize the performance of your applications and websites.
How to get synthetics monitoring to work in new relic?
Setting up synthetics monitoring in New Relic is a straightforward process. Here’s a step-by-step guide to help you get started:
Step 1: Sign up for a New Relic Account
If you don’t already have a New Relic account, you will need to sign up for one. You can sign up for a free trial account on the New Relic website, which will give you access to the synthetics monitoring feature.
Step 2: Install the New Relic Synthetics Agent
Once you have a New Relic account, you will need to install the New Relic Synthetics agent on your applications or websites. The Synthetics agent is a lightweight piece of software that runs on your servers and collects data about the availability, performance, and functionality of your applications and websites.
To install the Synthetics agent, you will need to follow the installation instructions provided by New Relic, which may vary depending on your application or website’s technology stack. The installation process typically involves downloading and running a script or installing a package, and it’s well-documented in the New Relic documentation.
Step 3: Create Synthetics Monitors
Once the Synthetics agent is installed, you can start creating synthetics monitors in New Relic. Synthetics monitors are the tests that simulate user interactions with your applications and websites. You can create different types of monitors, such as ping monitors, simple browser monitors, scripted browser monitors, and API monitors, depending on your monitoring requirements.
Ping monitors are the simplest type of monitors that check the availability of a URL or IP address by sending a ping request.
Simple browser monitors simulate user interactions with your applications or websites by navigating through pages and interacting with elements such as buttons and forms. Scripted browser monitors allow you to create more complex tests by writing scripts using JavaScript, which gives you greater flexibility in simulating user interactions and validating responses. API monitors test the availability and performance of APIs by making API requests and validating responses.
To create a synthetics monitor, follow these steps:
- Log in to your New Relic account and navigate to the Synthetics section in the left-hand menu.
- Click on the “Create a monitor” button.
- Choose the type of monitor you want to create, such as ping monitor, simple browser monitor, scripted browser monitor, or API monitor.
- Configure the monitor settings, such as the URL or API endpoint to monitor, the location from which to run the test, and the frequency and duration of the tests.
- Set up validation criteria to determine if the test is successful or not. For example, in a simple browser monitor, you can specify the expected text on a page or validate the response code of an API request.
- Save the monitor and optionally set up alert policies to receive notifications when the monitor fails.
Step 4: Analyze Synthetics Monitoring Results
Once you have set up synthetics monitors in New Relic, you can start analyzing the monitoring results to gain insights into the performance and availability of your applications and websites. New Relic provides a comprehensive set of monitoring and reporting features that allow you to analyze the results of your synthetics tests and make informed decisions.
You can view the results of your synthetics tests in the Synthetics section of your New Relic account, where you can see the status of each monitor, the response time, the error rate, and other metrics. You can also view detailed reports that show the historical performance of your monitors over time, allowing you to identify trends and patterns.
New Relic also provides alerting features that allow you to set up alert policies based on the results of your synthetics tests. For example, you can set up alerts to notify you when a monitor fails or when the response time exceeds a certain threshold. Alerts can be sent via various channels, such as email, SMS, or integrations with third-party tools like Slack or PagerDuty, allowing you to take proactive actions to resolve issues as soon as they are detected.
Step 5: Optimize Synthetics Monitoring
To ensure that synthetics monitoring is working effectively in New Relic, it’s important to continually optimize your tests and monitoring configurations. Here are some best practices to help you get the most out of synthetics monitoring:
Review and update your tests regularly:
Applications and websites can change over time, so it’s important to review and update your synthetics tests regularly to ensure they accurately reflect the user interactions and functionality of your applications or websites. Make sure your tests are still relevant and provide meaningful insights into the performance and availability of your applications or websites.
Set up realistic test scenarios:
When creating synthetics tests, it’s important to simulate realistic user interactions and scenarios to accurately reflect how real users interact with your applications or websites. For example, if your application has multiple user roles or permissions, make sure your tests cover different user scenarios to accurately reflect the performance and functionality of your application.
Choose appropriate test locations:
New Relic allows you to choose the locations from which to run your synthetics tests. Choose locations that are relevant to your user base and the regions where your applications or websites are hosted. This will help you identify performance and availability issues that may vary across different geographic regions and network conditions.
Set up meaningful validation criteria:
Validation criteria are used to determine if a synthetics test is successful or not. It’s important to set up meaningful validation criteria that accurately reflect the expected behavior of your applications or websites. For example, if you are monitoring a login page, you can validate that the login form is displayed, the login button is clickable, and the user is redirected to the expected page after successful login. Avoid using generic validation criteria that may not accurately reflect the actual functionality of your applications or websites.
Use scripting capabilities for advanced testing:
New Relic’s scripted browser monitors allow you to write custom scripts using JavaScript, which gives you greater flexibility in simulating complex user interactions and validating responses. Leverage the scripting capabilities to perform advanced testing scenarios, such as filling out forms, clicking on dynamic elements, and validating dynamic content. This will allow you to capture more detailed performance and functionality insights from your applications or websites.
Monitor key transactions and APIs:
Identify the critical transactions and APIs in your applications or websites and prioritize monitoring them using synthetics tests. For example, if you have an e-commerce website, monitoring the checkout process and APIs related to payment processing would be crucial. This will help you quickly detect and resolve any performance or availability issues that may impact the user experience and business outcomes.
Collaborate with teams:
Synthetics monitoring is not just the responsibility of the operations or DevOps team, but it should involve collaboration with other teams, such as development, QA, and business stakeholders. Engage in cross-functional discussions to define meaningful test scenarios, validate validation criteria, and analyze monitoring results. This will help you get a holistic view of the performance and availability of your applications or websites and make informed decisions to optimize their performance.
Set up alert policies strategically:
Alerts are crucial for proactively identifying and resolving issues detected by synthetics monitors. However, setting up too many alerts or alerts with low thresholds can result in alert fatigue and noise, making it difficult to identify critical issues. Define alert policies strategically by considering the impact of issues on user experience and business outcomes. Set up alerts with appropriate thresholds and escalation levels to ensure that critical issues are promptly notified to the right teams for resolution.
Monitor beyond uptime:
While synthetics monitoring is essential for checking the availability of your applications or websites, it’s also important to monitor beyond uptime. Use synthetics tests to capture performance metrics, such as response time, page load time, and transaction completion time, to understand the actual user experience. Analyze performance trends over time and identify any degradation in performance that may impact the user experience. This will help you proactively optimize the performance of your applications or websites and ensure a seamless user experience.
Integrate with other New Relic features:
New Relic offers a suite of monitoring and observability features that can be integrated with synthetics monitoring to provide a holistic view of the performance and availability of your applications or websites. For example, you can integrate synthetics monitoring with New Relic APM (Application Performance Monitoring) to correlate synthetics test results with application performance metrics, such as transaction traces and error rates. This will help you quickly identify the root cause of performance issues and resolve them efficiently.
Last Thoughts
In conclusion, synthetics monitoring in New Relic is a powerful tool to ensure the performance and availability of your applications or websites. By following best practices such as reviewing and updating tests regularly, setting up realistic test scenarios, using scripting capabilities for advanced testing, monitoring key transactions and APIs, collaborating with teams, setting up alert policies strategically, monitoring beyond uptime, and integrating with other New Relic features, you can effectively leverage synthetics monitoring to gain insights into the performance and availability of your applications or websites, and proactively optimize their performance for a seamless user experience. Hope now you know How to get synthetics monitoring to work in new relic.